Python Replication
Exportation was done from both APIs bitcoin-data.com and complemented with fallback data from Blockchain.com info are on a daily basis, and I computed daily data to get weekly ones.
Weekly data for all indicators was derived by identifying Mondays within the dataset.
When data for a specific Monday was unavailable, the closest preceding value within a seven-day range was used.
For all indicators, missing values were forward-filled, ensuring continuity and reliability across the entire time series.
Several factors can influence the replication process and contribute to discrepancies between TradingView values and replicated values. Although not exhaustive, one common issue arises when an API fails to provide data for a specific week. This can disrupt calculations such as moving averages or shift the reference point for the end of the week. Additionally, the chosen trading pair can introduce variations; APIs typically use the BTC/USD pair from a specific exchange, while TradingView often employs the aggregated “BTC/USD Crypto” pair, which combines data. Last but not least, there are differences in computation methods by APIs, such as distinct formulas or division factors (e.g., for the CVDD indicator), that increase delta. However, overall, results are pretty satisfying.A huge thanks to bitcoin-data, which is the only one I’ve found that provides free various data (30 requests limit per hour).
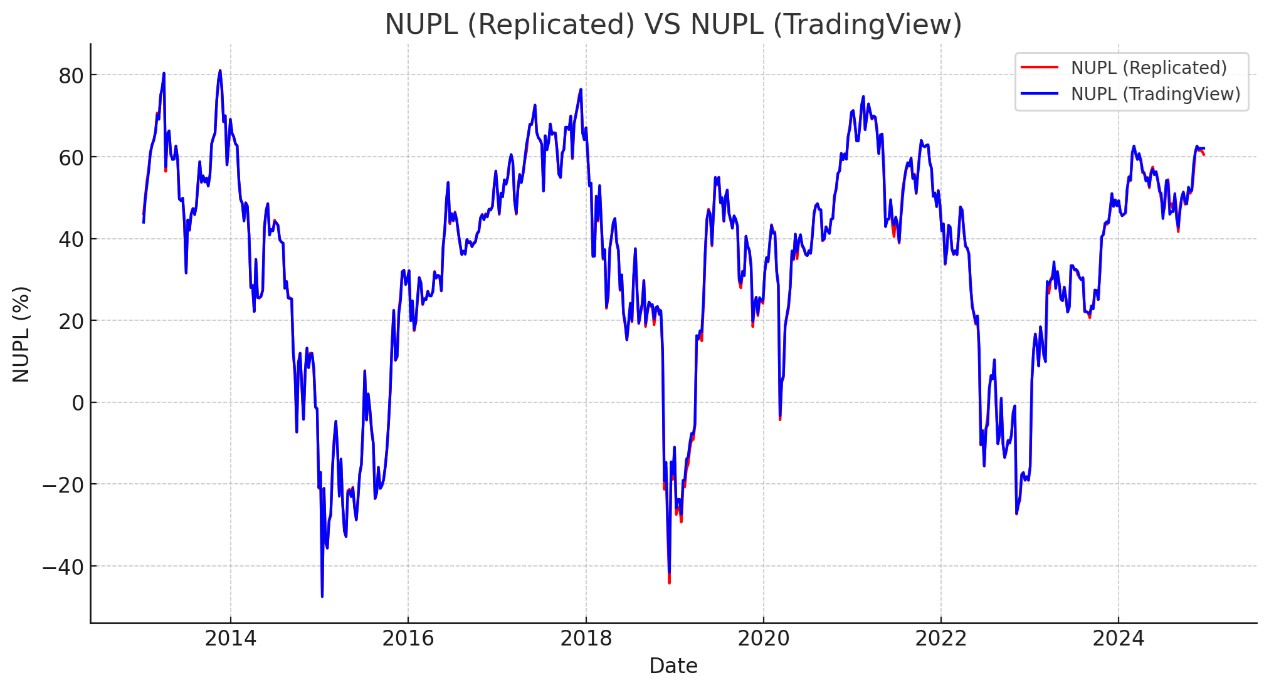
Net Unrealized Profit and Loss (NUPL)
- Calculation: A percentage that measures the overall profitability of Bitcoin holders in the market.

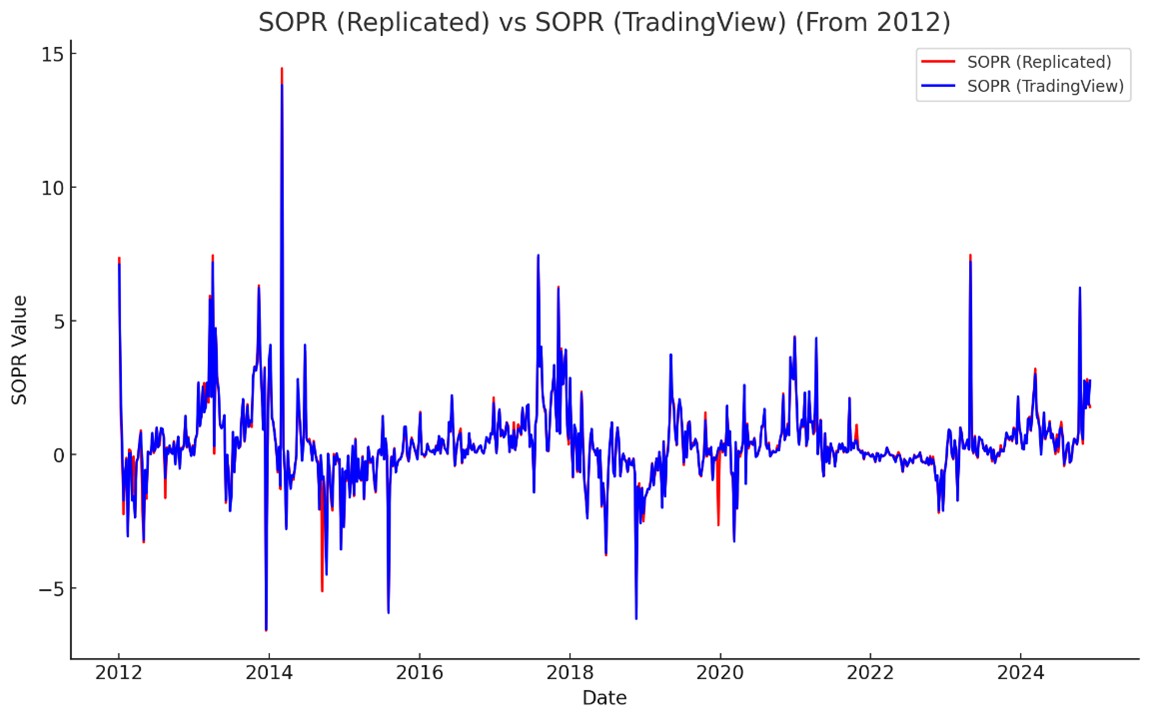
Spent Output Profit Ratio (SOPR)
- Calculation: A smoothing mechanism was applied using the exponential moving average to compute Signal Line:

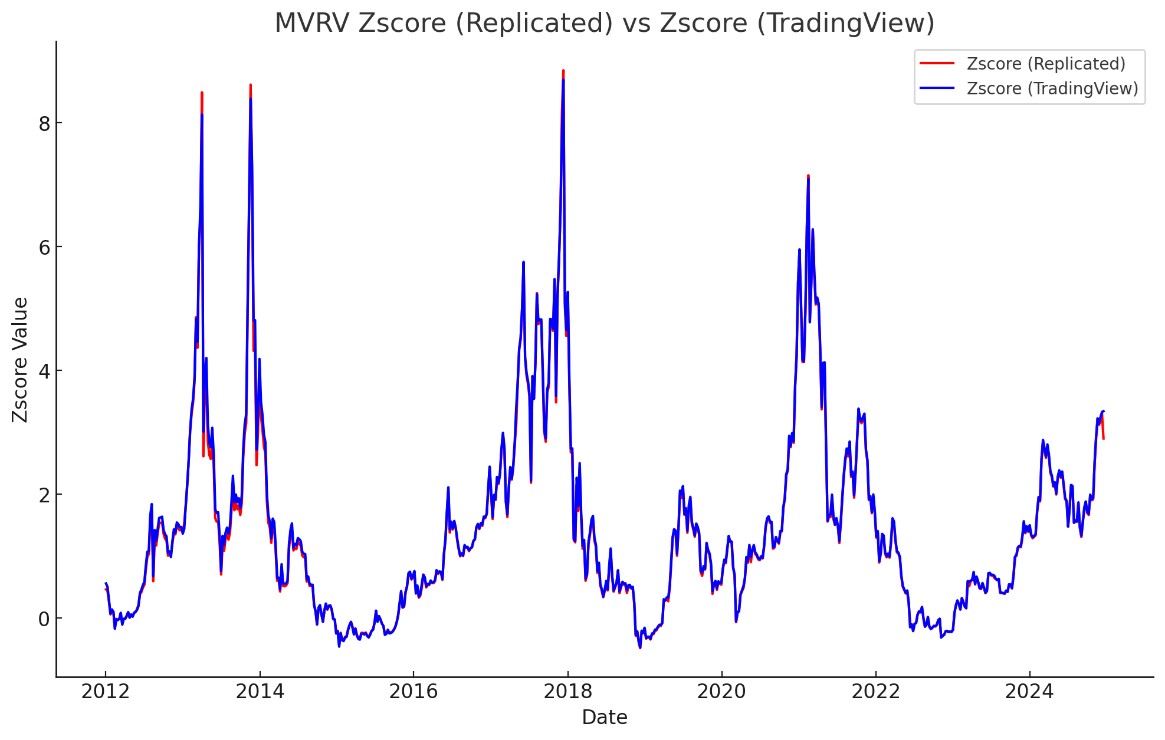
Market Value to Realized Value Z-score (MVRV-Z)
- Calculation: The Z-score normalization of MVRV (historical standard deviation), where MVRV = Market Cap / Realized Cap.

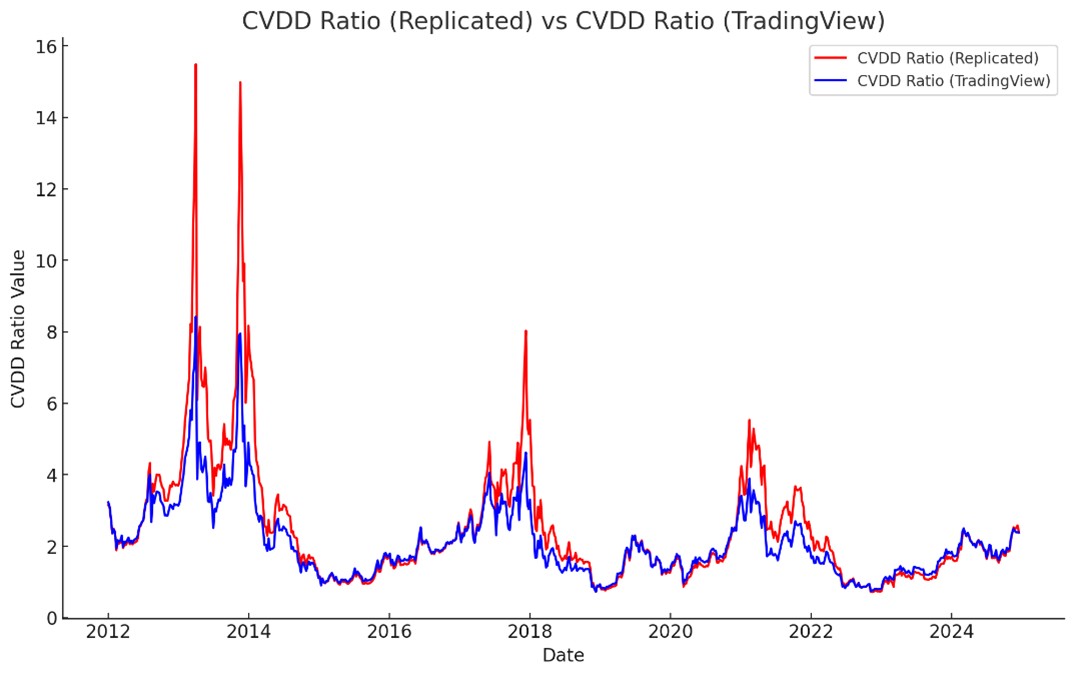
Cumulative Coin Value Days Destroyed (CVDD)
- Calculation: CVDD incorporates cumulative value days destroyed (CDD) and market age. Adjusted CVDD was obtained by scaling CVDD (150%).
![]()
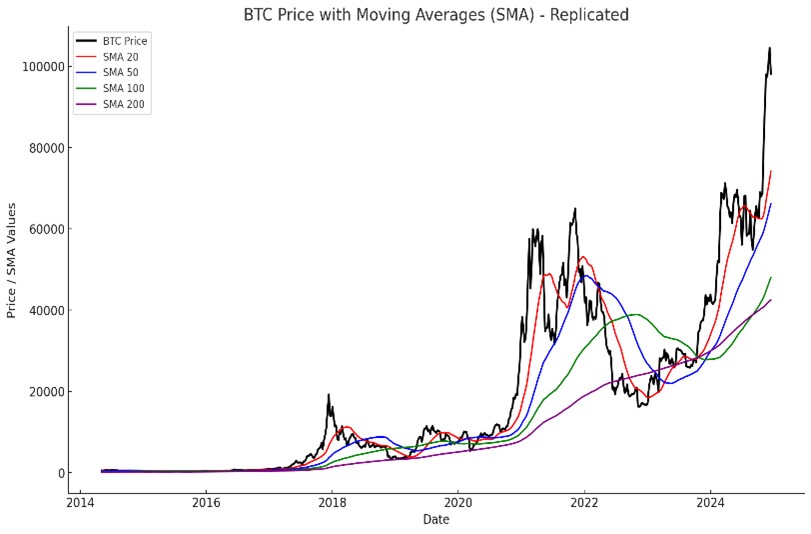
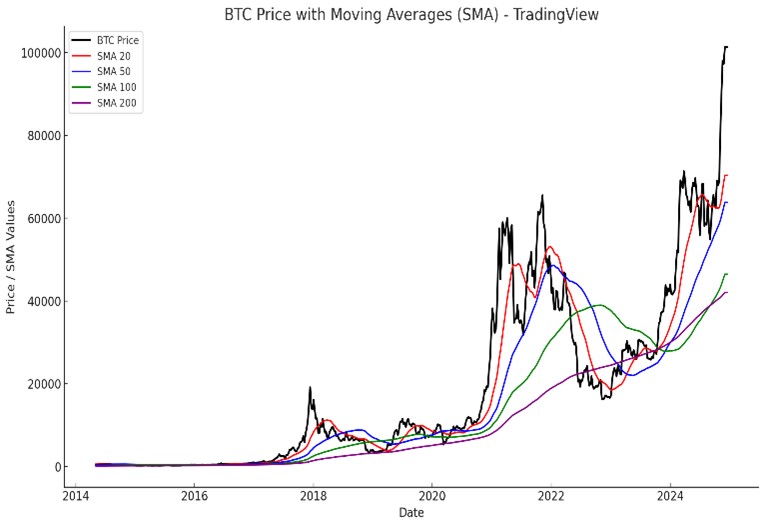
Simple Moving Averages
- Calculation: Simple moving averages (SMA) were computed over different windows (20, 50, 100, 200 days).

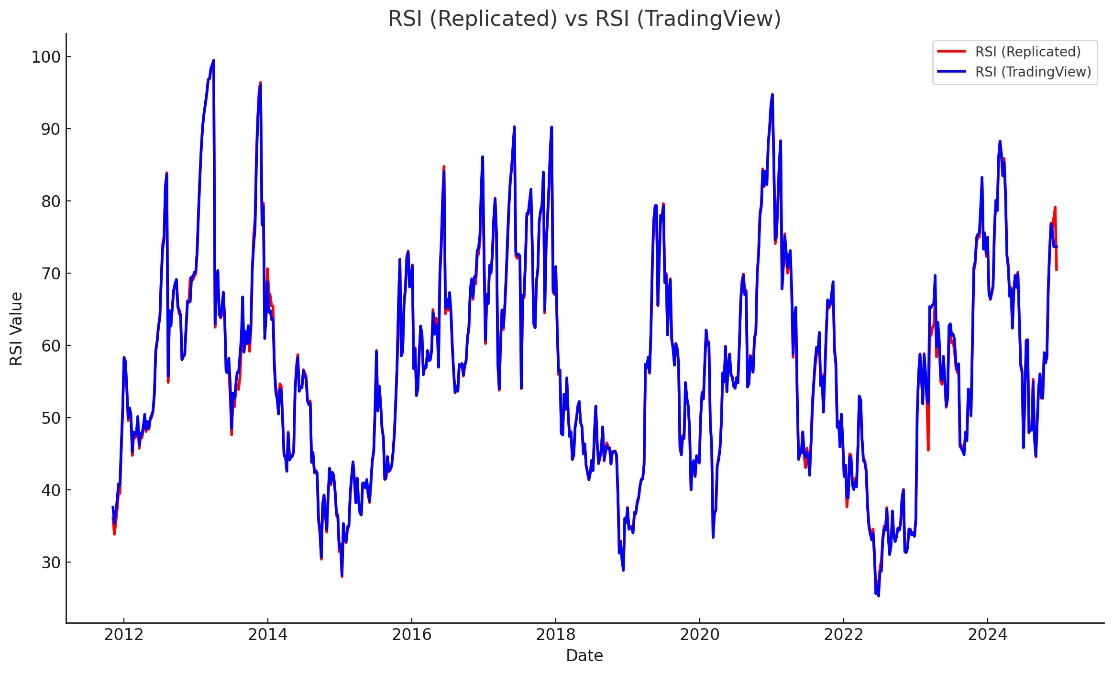
Relative Strength Index (RSI-14EMA)
- Calculation: Gains and losses were computed using exponential weighted averages over a 14-day period:


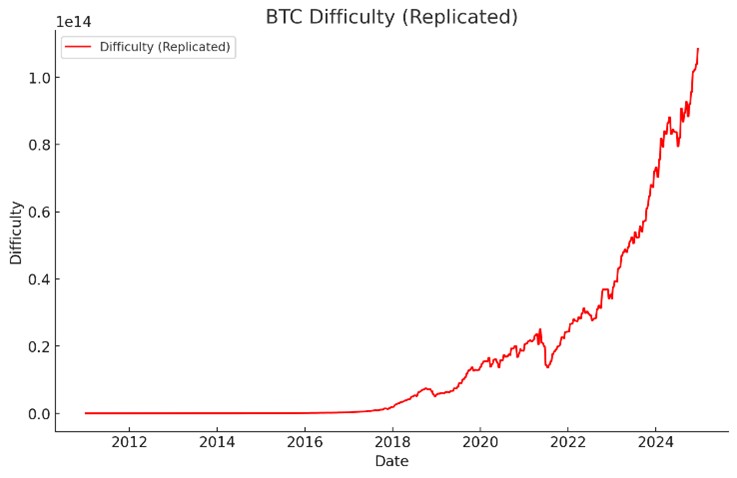
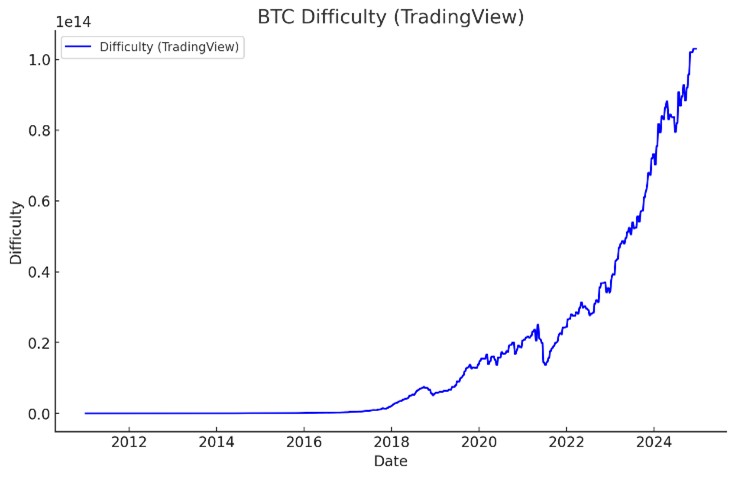
Bitcoin Difficulty Ratio (14EMA)
- Calculation: A smoothing mechanism was applied using the exponential moving average:

Now that I've successfully replicated almost perfectly required independent indicators, it's time to focus on dependent variable.
Next here ⏭️: Dependent Variable